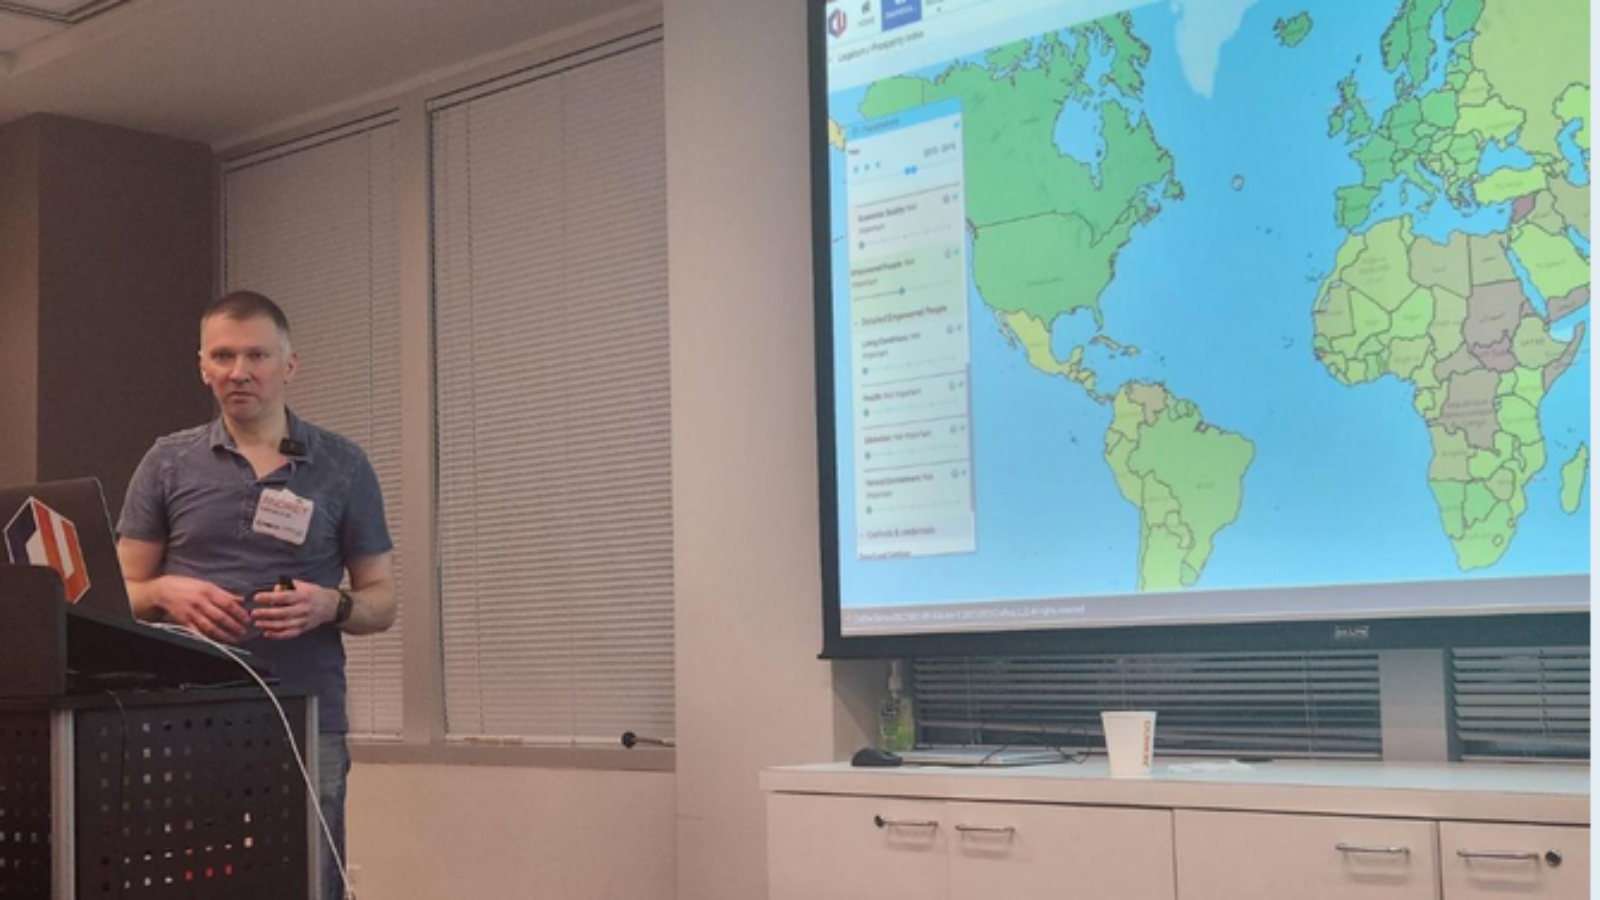
Data Visualization DC is the largest dataviz event in DC are bringing together dozens of data analytics and visualization professions every month. Today I was given an opportunity to share the first preview of Craftus US Counties project I’m currently working on and getting ready for the public release.
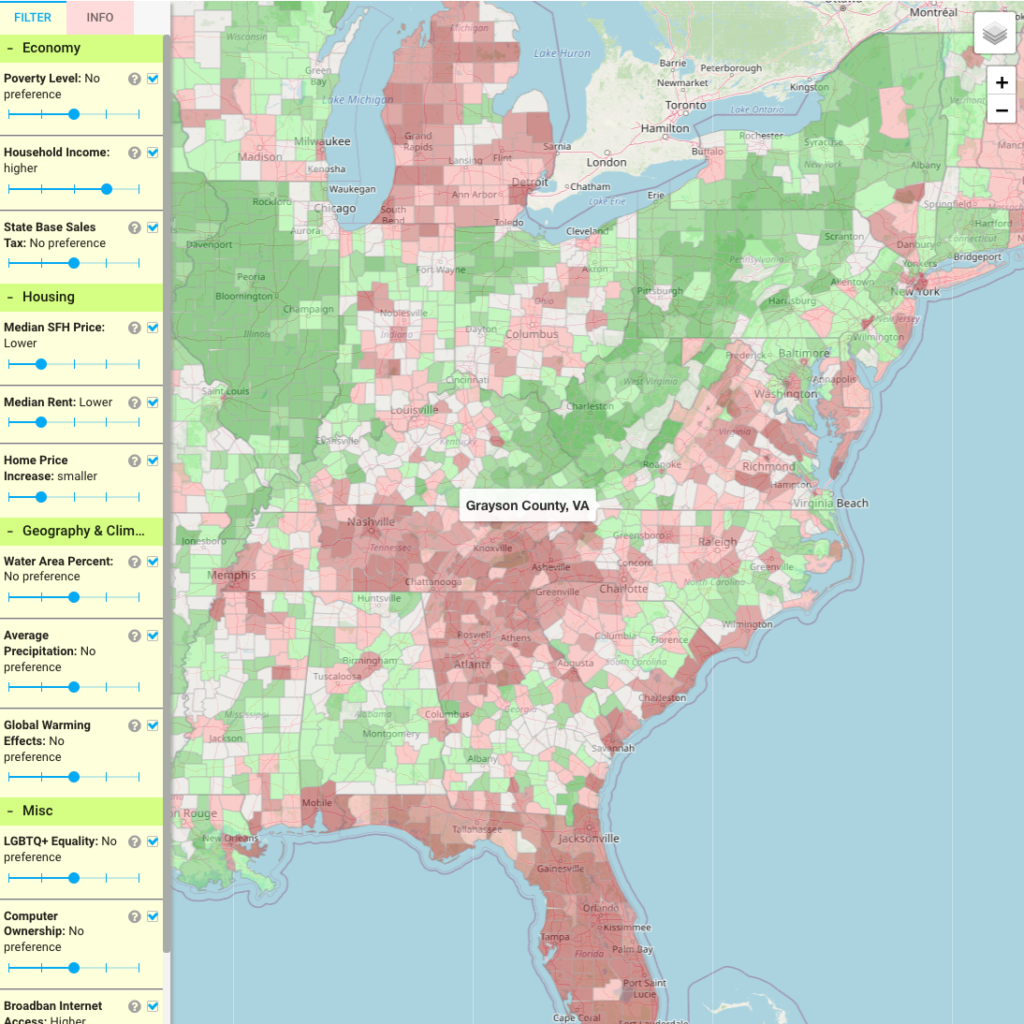
USCounties helps people to explore the United States from the geographical, economic, social and other prospectives. It allows users to choose a place they would want to travel to or, perhaps, even relocate to, based on the their preferences.
You may have seen articles like “10 Best States to Retire” or “50 Best States to Start your Business”. These ratings have two huge problems:
- They are talking about States – huge and diverse territories. Suggesting someone to retire in Florida is meaningless without clarifying if they mean Everglades or Miami.
- These ratings are built based on the author’s decision about what places are good and what are bad. Since we’re all different, these rating criteria most likely do nto match yours.
US Counties addresses both of these issues by allowing the user to specify their personal preference and selecting what’s important to them and what’s not. It also visualizes the data down to one of 3000+ counties in the United States, helping to find a much smaller area of interest then an entire state.
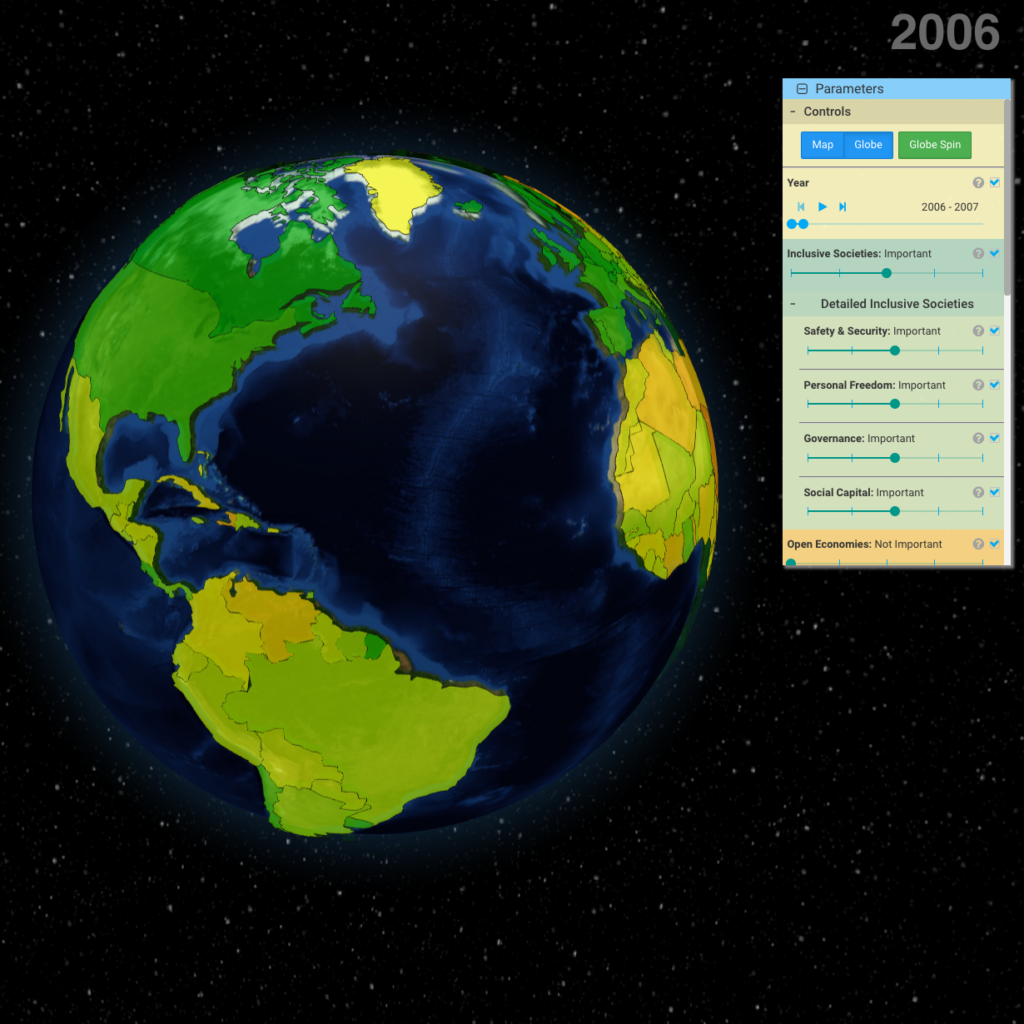
In the beginning of this presentation I also shared a data visualization made with Craftus Data Analytics Studio showing various factors of prosperity around the world. This data was kindly offered by The Legatum Institute to everyone curious about the current state of the world and different aspects of what is called “prosperity”, which is not just the money, but also Healthcare, Governance and more.