

Craftus Space Analytics is one of the best-in-class tools providing realtime tracking and visualization of all publicly known space objects.
With the permission of the US Space Command we're publishing this data to raise awareness of the space debris problem.
We also see this capable platform as a foundation for the future space mission control systems. It offers not just unbeatable performance characteristics and excellend user experience, but also data representation in augmented and virtual reality.
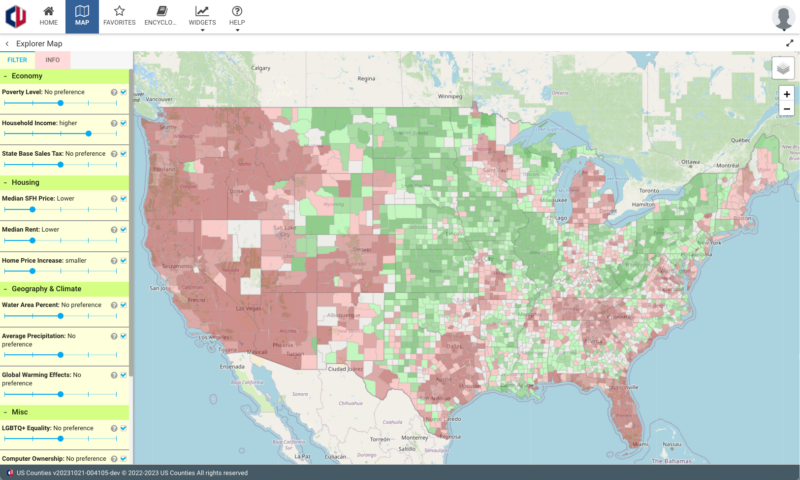
US Counties provides data analytics for the United States of America at the county level, across all aspects of everyday life.
It offers an easy-to-use interface allowing the user to visualize different aspects of the United States economy, demographics, geography, laws and more.
This project helps individuals, researchers, data journalists, and policymakers to explore the United States in all its diversity.

Craftus Data Studio is a full-stack data extraction, processing, and visualization tool. Unlike its competitors (Tableau, Power BI), it offers everything you need for the full cycle from data extraction to visualization publication in a single system that is easy to install and use.
It allows you to create dashboards that are more versatile and beautiful than Tableau and extract data from more data sources than Power BI.
In addition to standard pie/bar charts, it offers over 30 different types of widgets, including ones that visualize your data in Augmented or Virtual Reality. It also offers an easy way to integrate your existing data sources, AI models, or visualizations into its dashboards and can be easily integrated with your existing solutions via embedding, API, and more.

411Labs Sherpa is an Enterprise Social Collaboration Analytics Platform developed for and in cooperation with 411Labs Inc.
By connecting to multiple enterprise data sources, it can help with analytics on employee retention, identifying internal talent, prediction project success, recommendations on the workforce management and more.
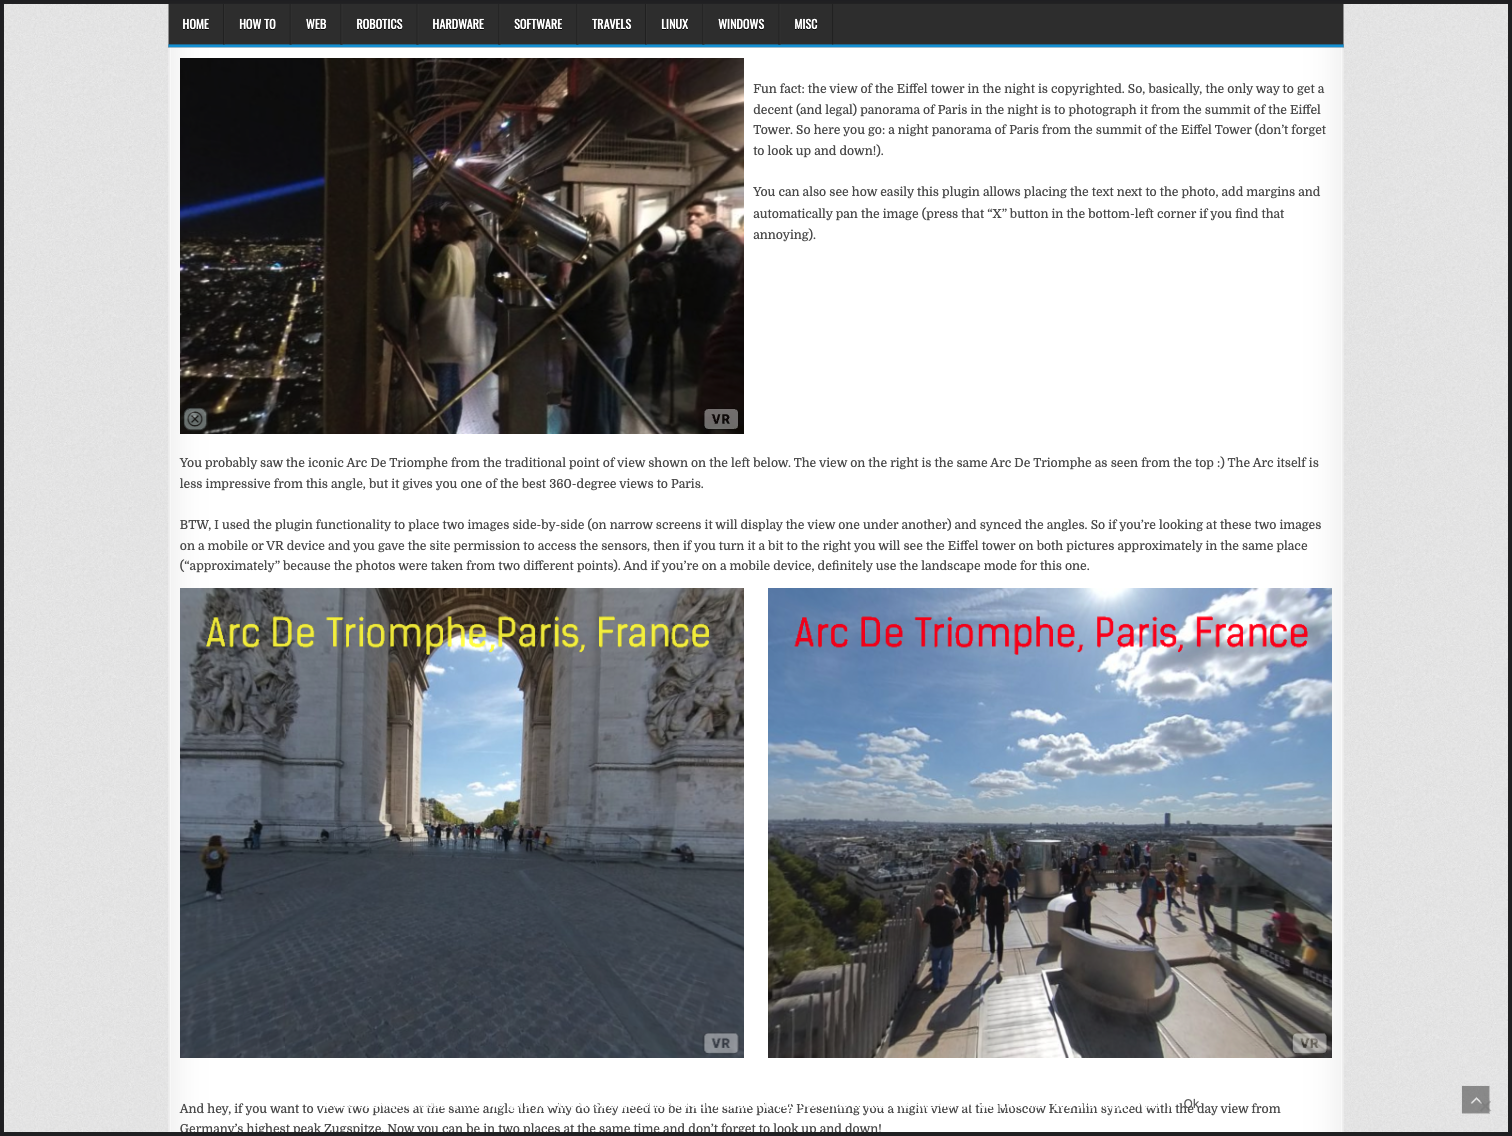
360-Degree View is a project sponsored by Craftus and maintained by one of its developers. It's the most comprehensive and feature-rich free WordPress plugin for embedding 360-degree photos and videos into your blog posts and pages
You can learn more about 360-Degree View WordPress plugin here: https://andrey.mikhalchuk.com/360-view-wordpress-plugin
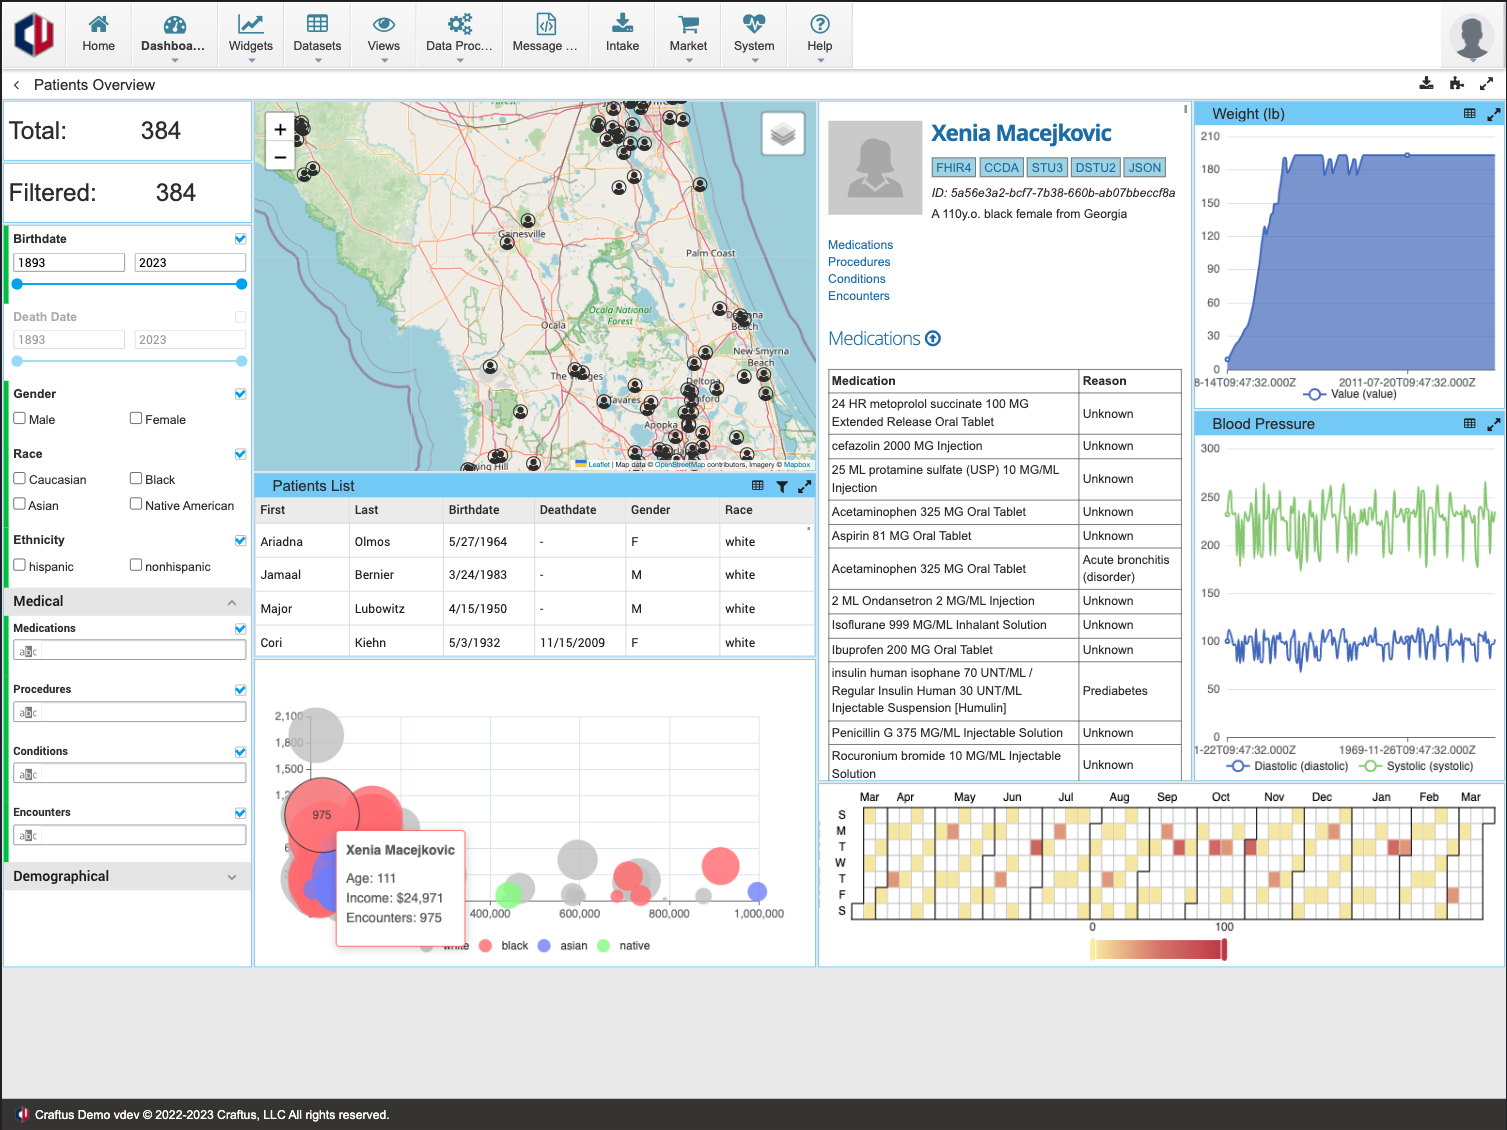
Craftus Healthcare Analytics is a powerful tool for navigating and visualizing patient data. It is also equipped with a powerful synthetic content generator allowing to generate patient content for your development needs.
If you're interested in using Craftus Healthcare solutions in your organization, please contact us for a demo and your requirements discussion.

restARant is a prototype of an Augmented and Virtual Reality-enhanced restaurant online presence, menu, ordering and delivery system.
It is compatible with all smartphones, tables, computers and AR/VR headsets and provides an immersive experience to its users, greatly increasing the foot traffic and visitor conversion into "regulars".
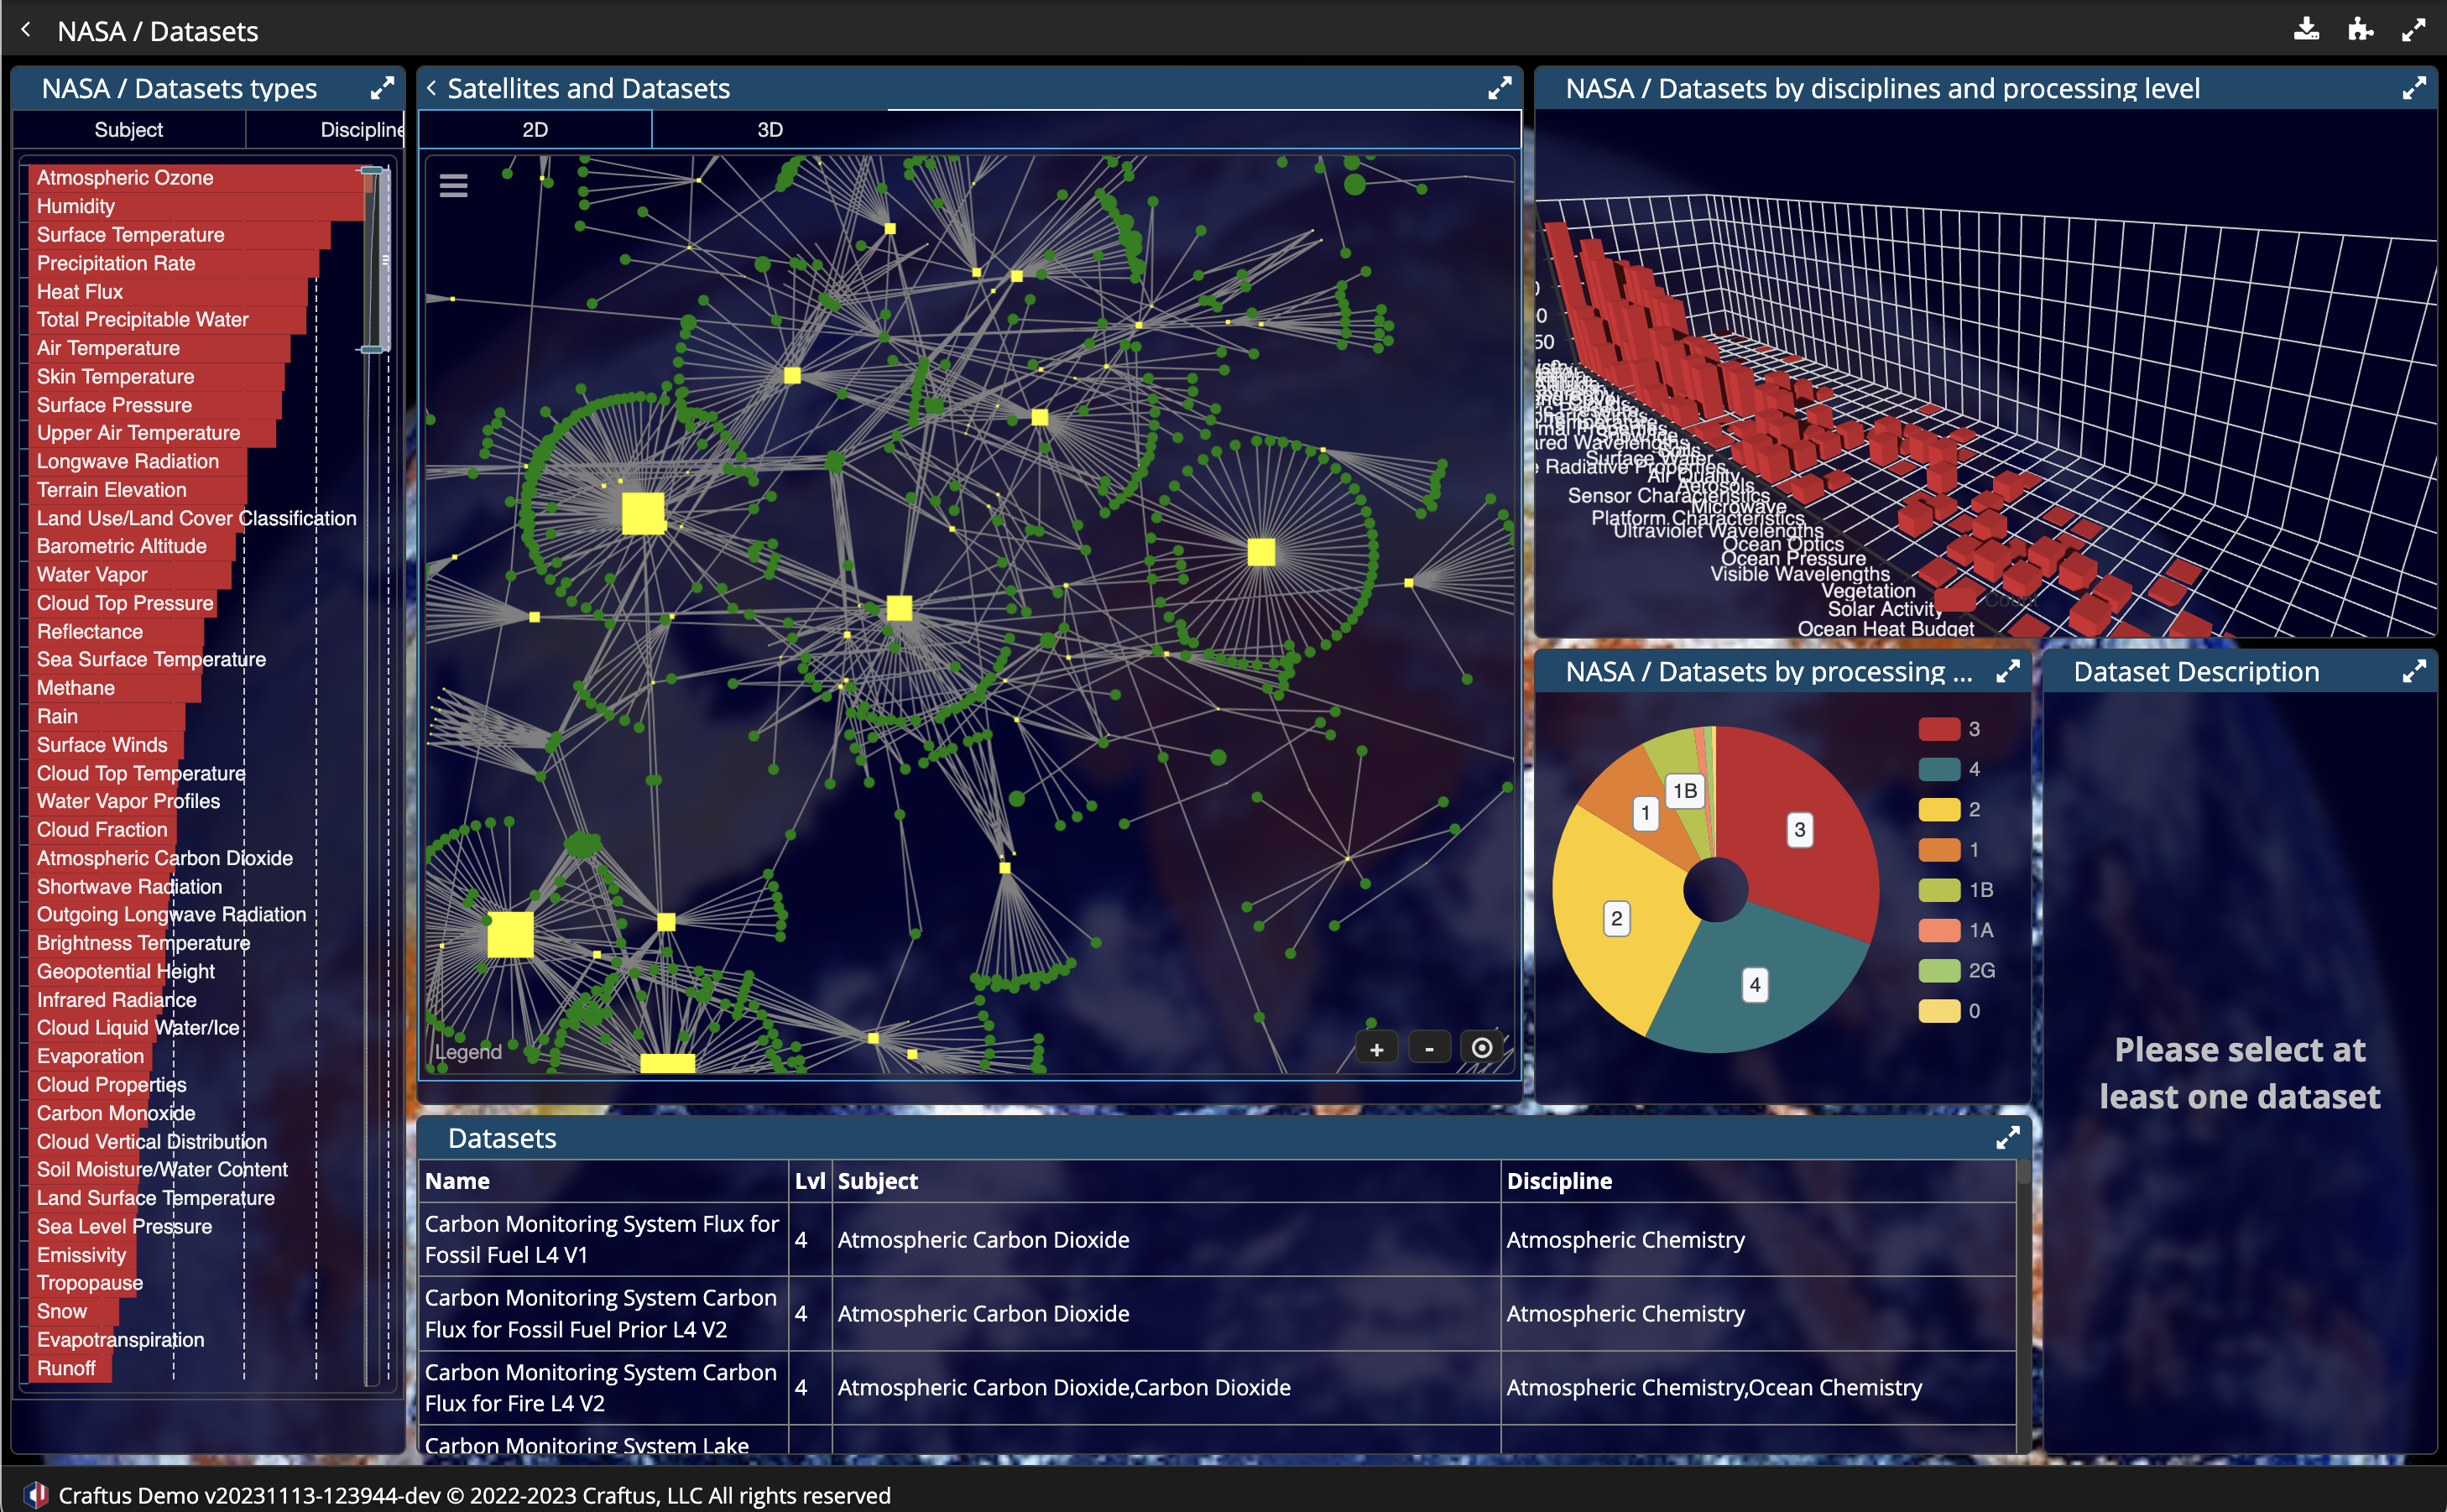
This dashboard was created with Craftus Data Studio. It provides an insight into NASA Goddard Earth Sciences (GES) Data and Information Services Center (DISC)'s many datasets coming from over 250 different satellites.
This dashboard illustrates how Craftus Data Studio could be used for fully-automated data extraction, analytics and visualization.
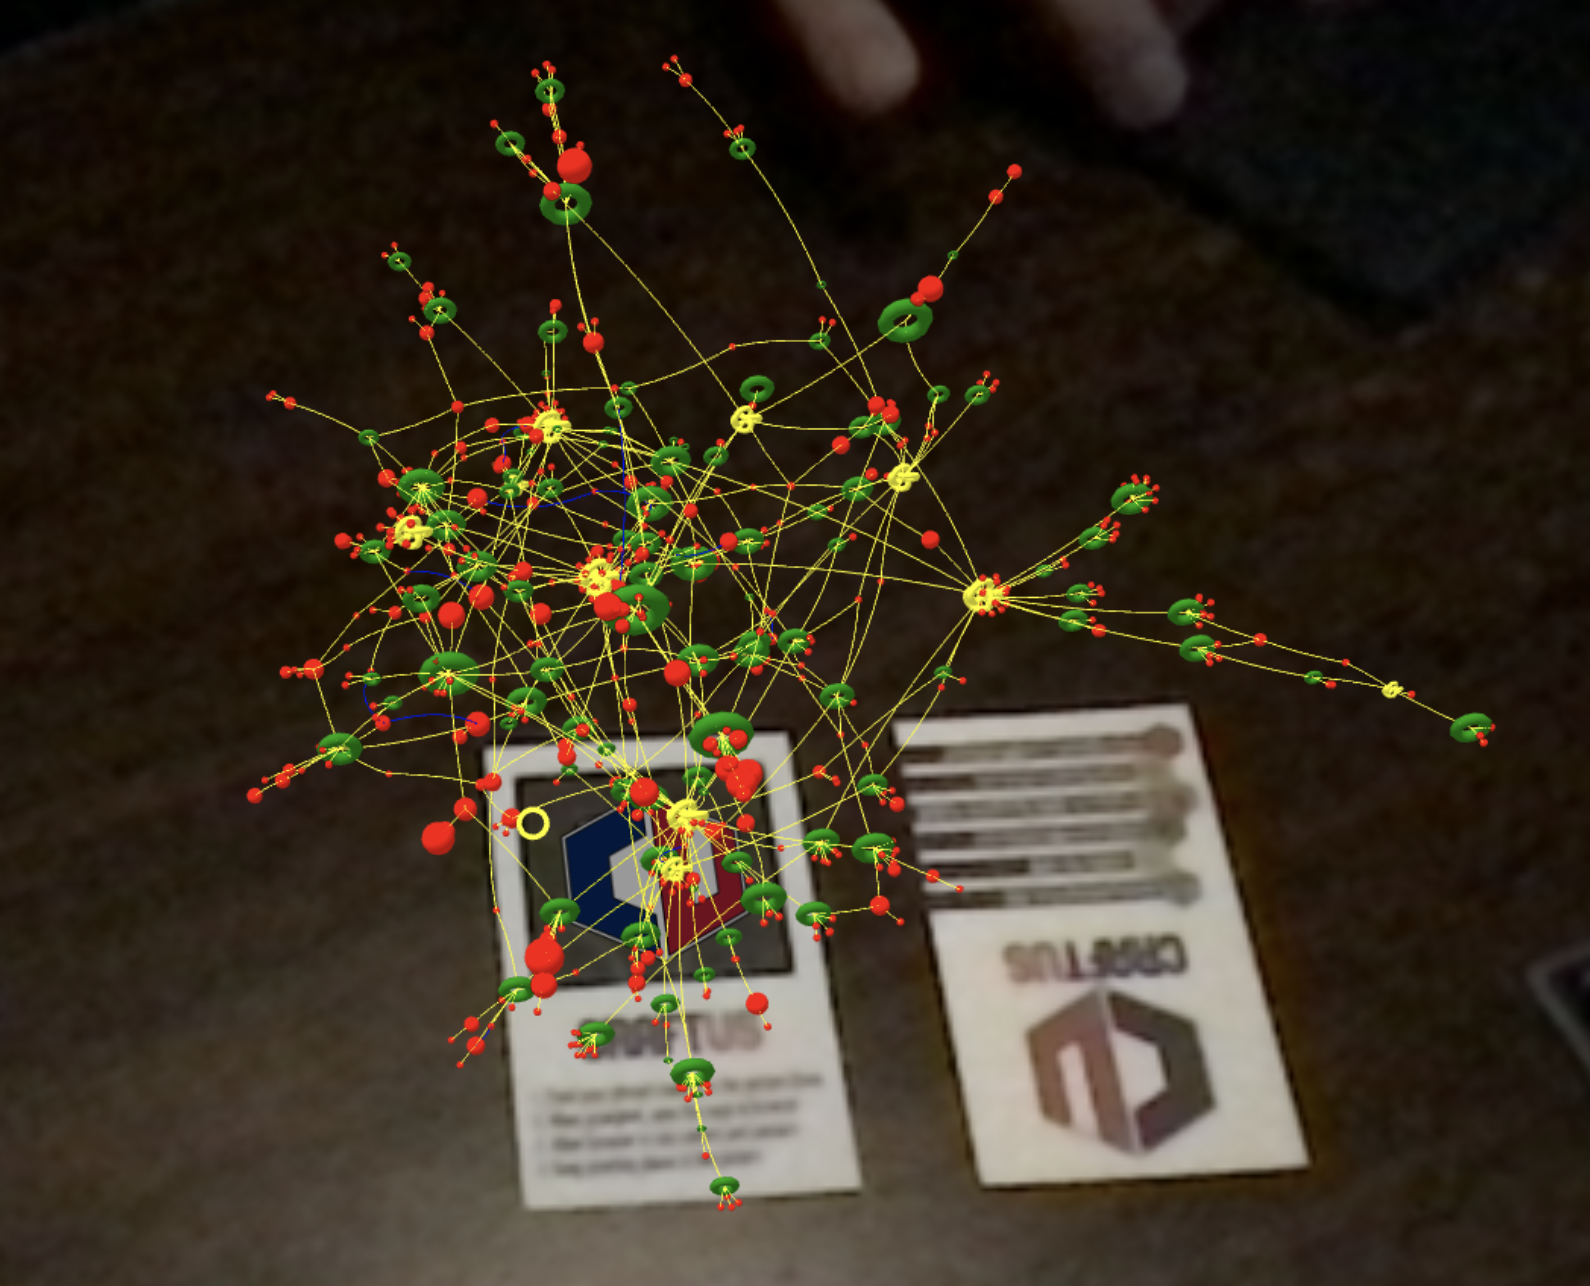
Some of our data visualization projects are done in Virtual or Augmented reality. This adds a new dimension to your data and provides new, unique ways to explore complex interconnections between different datasets.
If you are interested in exploring what value AR/VR could add to your business, please check out the project page providing some additional information and feel free to contact us for more details.
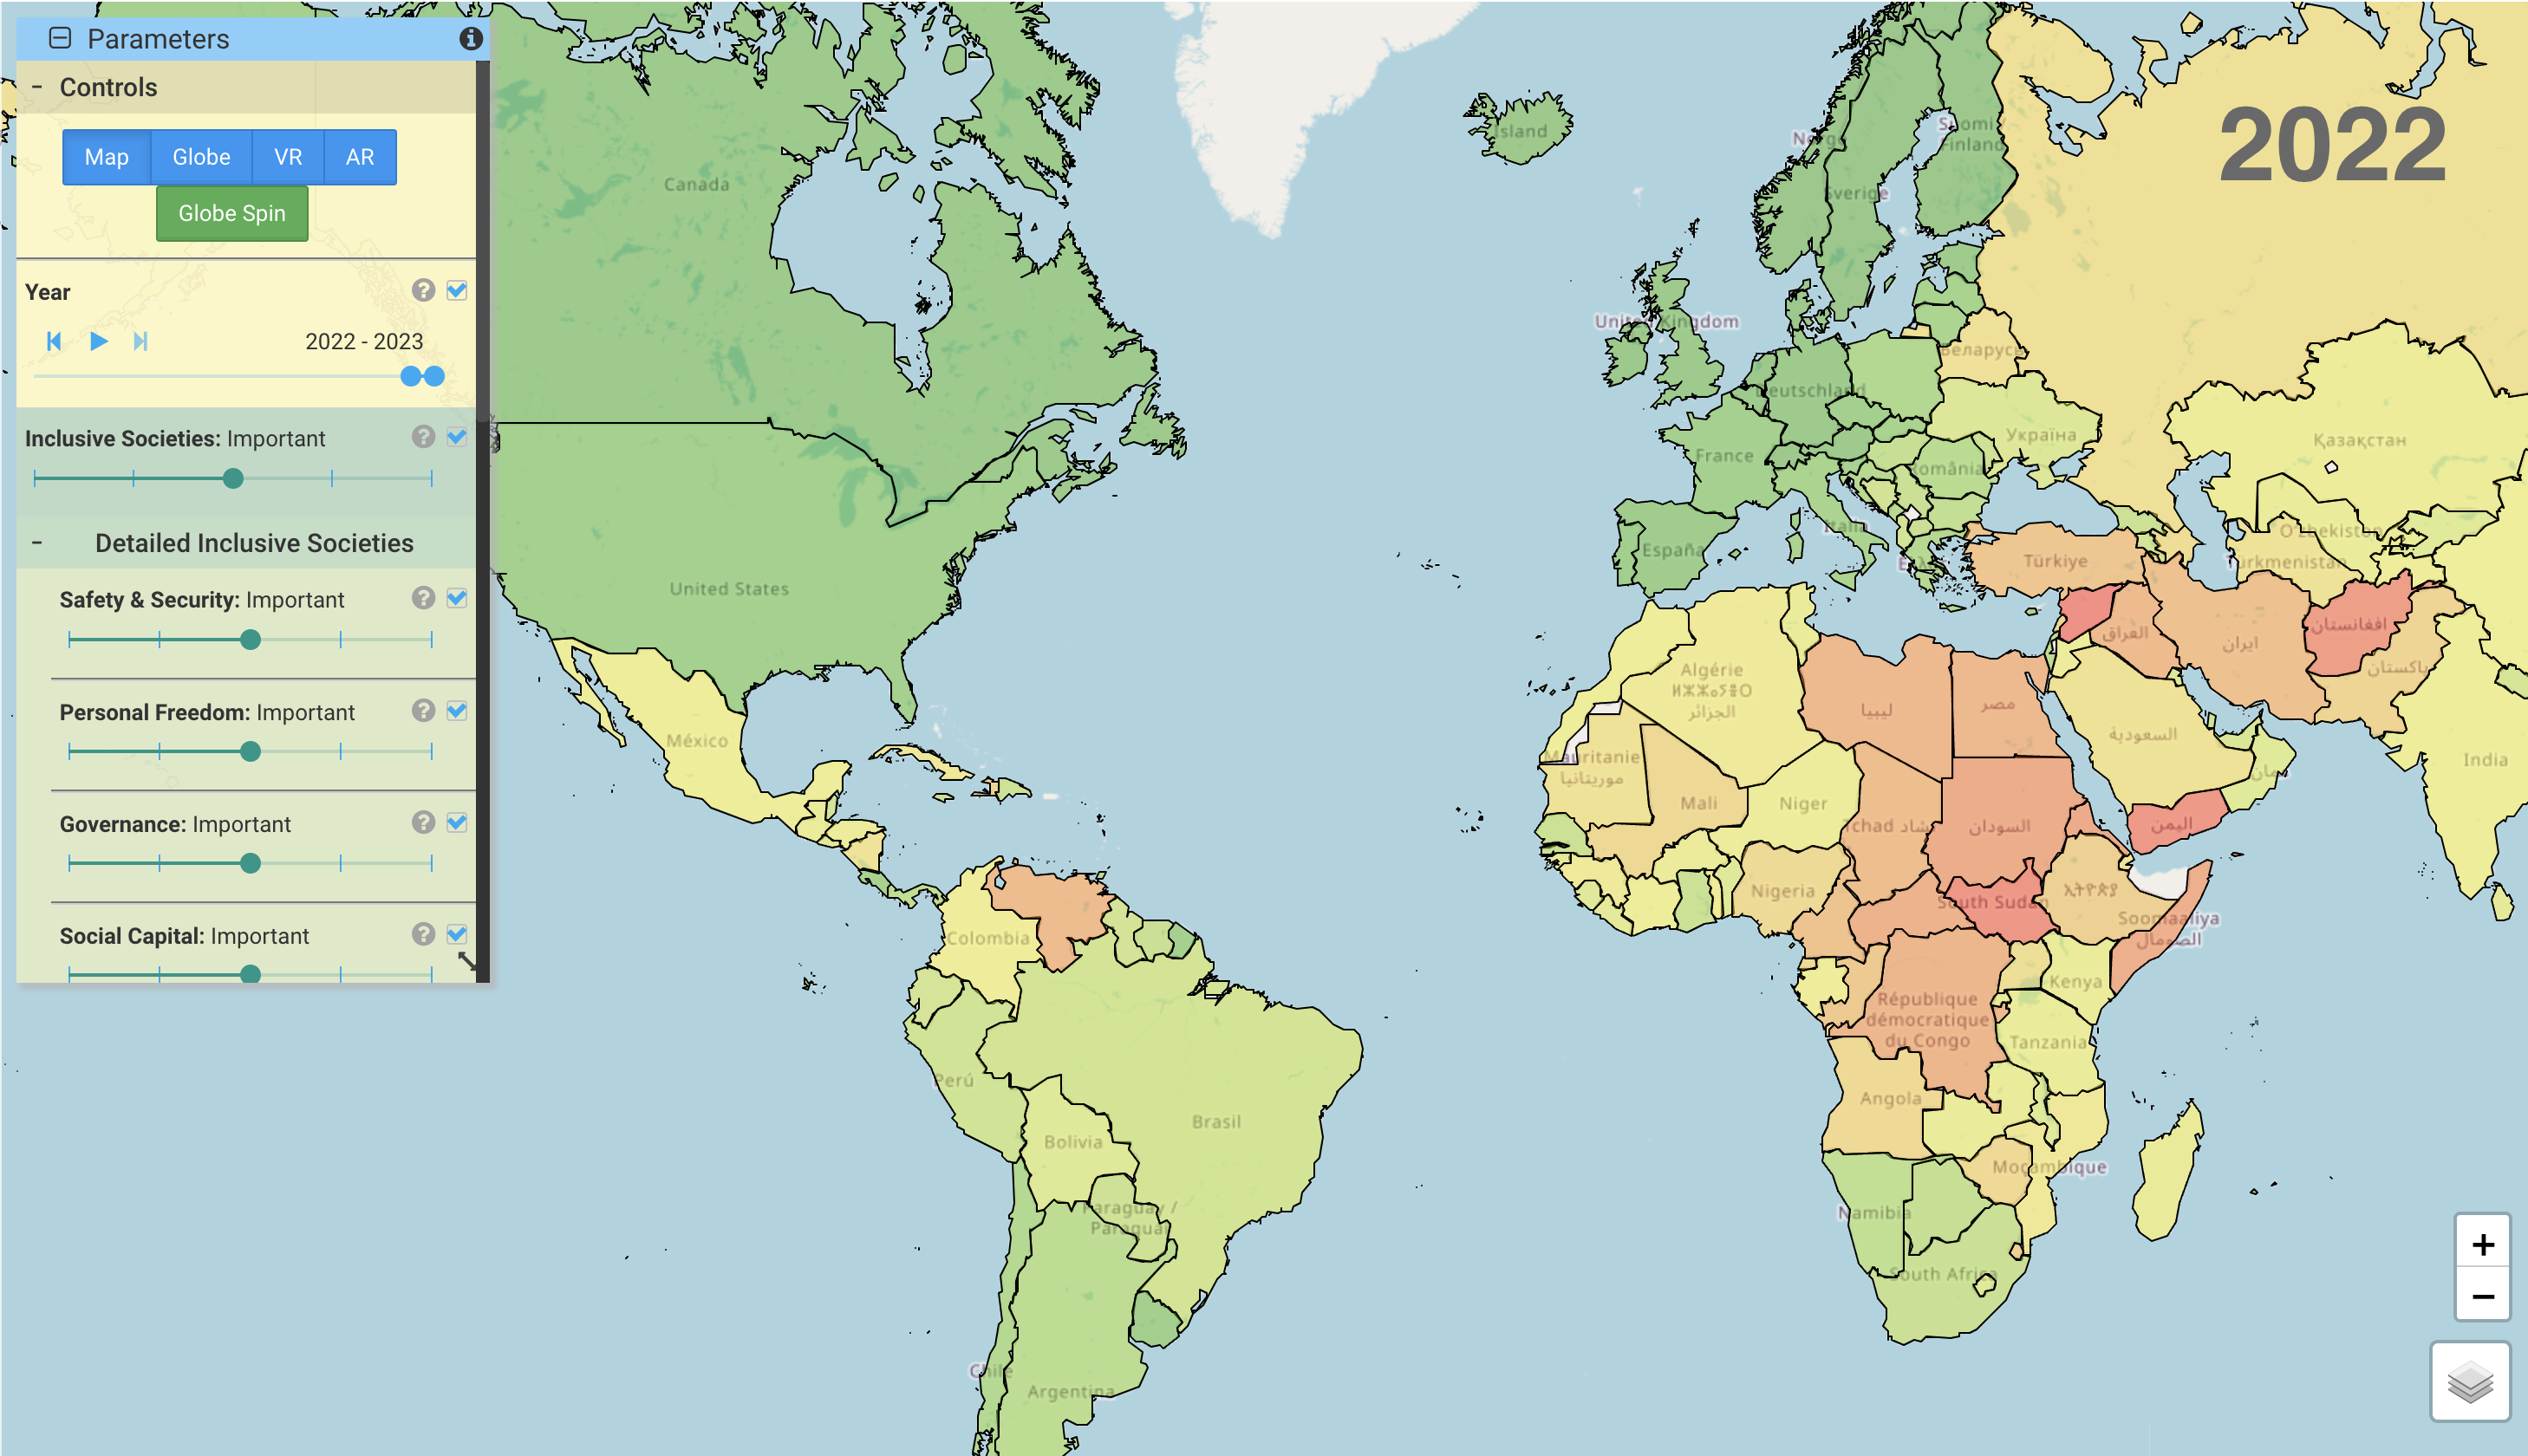
Legatum Institute researches world prosperity and maintains its Legatum Prosperity Index since 2006. This dashboard uses their data to provide and easy-to-use interface to those who wish to dig deeper into their multilevel statistics about social and economical well being of the nations of the world.
This dashboard was built with Craftus Data Studio and it provides 2D (map), 3D (globe), VR and AR visualizations of Legatum's data. Please feel to contact us for more details.