Expanding Reality
Sometimes pie charts are just not enough
We all got used to the standard (and frequently boring) dashboards filled with piecharts, bar charts and scatterplots. But what if what you want to present just doesn't fit the standard 2 dimensions? What if you need to blend your results with the real world?
Craftus offers a wide spectrum of VR and AR solutions that will make your data pop into reality. Let's take a look at a few examples ...
Marker-based Augmented reality
Marker-based AR is, possibly, the least expensive way to augment reality. All you need is your smartphone (or a tablet or a PC/Mac, anything with a display and a camera that can run a web browser should do) and a special marker generated by our software.
On this page you can see a few visualizations done this way and can try them yourself. They work best when printed on paper and placed on a table, but you can also try pointing your smartphone right at the screen. Just avoid screen glare and extremely high brightness.
We also offer all markers used on this page in a single file, so you can make your AR experience a lot better by just printing that page and cutting it into markers, while making sure that there is at least 1/4″ of white space around them.

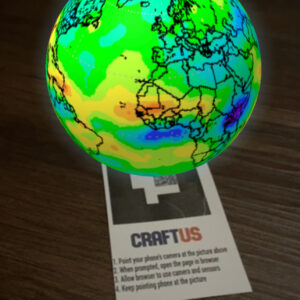
Check out this 3-Dimensional temperature tendencies visualization coming from NASA GES DISC website. This is just one example of how complex scientific data could be made a lot more exciting when presented in AR.
Note that this visualization was originally created to be viewed while the marker is positioned on the desk, so if you are looking at marker straight from the display, you will see the North Pole side and will need to look at the marker from a side (while keeping it in the camera’s field of view) to see most continents. Or you can just print it and explore it the way it was designed to be used.
In case if you are curious, the complete name of this dataset is “Global Modeling and Assimilation Office (GMAO) (2008), tavgM_3d_tdt_Cp: MERRA 3D IAU Tendency, Temperature, Monthly Mean V5.2.0, Greenbelt, MD, USA, Goddard Earth Sciences Data and Information Services Center (GES DISC), Accessed: 6/1/23, 10.5067/0ASY0WOAY6B7“.

This visualization shows cropland distribution across the world (shown in bright green). It is derived from multiple datasources, primarily 2015 Landsat imagery and uses machine learning to synthesize this beautiful visualization.
Just like the one from NASA, this visualization was originally created to be viewed while the marker is positioned on the desk, so if you are looking at marker straight from the display, you will see the North Pole side (not very exciting, since there is not much cropland on the North Pole yet). You need to look at the marker from a side (while keeping it in the camera’s field of view) to see most continents. Or you can just print it and explore it the way it was designed to be used.
This visualization represents the baseline of GFSAD30 Project and you can read more about it here and here.

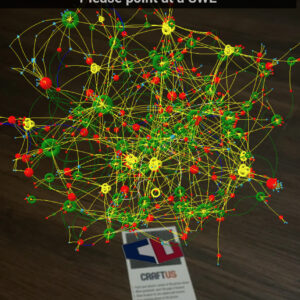
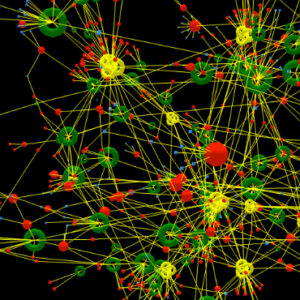
Unlike the previous two visualizations, this one is a lot more complex and interactive. It shows the Common Weakness Enumeration – one of the most fundamental blocks of modern cybersecurity. CWEs are maintained by Mitre Corporation and allow the researchers to classify various security threats according to a standardized category system.
The challenge of this system is that it’s so complex, it’s almost impossible to represent it as a whole, including all types of dependencies and categories. So AR seems like a perfect fit for something this complex.
At the top of this visualization you will find a series of checkboxes that will allow you to turn on and off various features, try checking and unchecking them and see what will happen.

Hungry? Ok, try this one, it’s unlike all other visualizations in this series. It’s not exactly about visualizing the data, but it’s just the hint of new exciting product coming soon …


Ok, this one is not ours, it was written by Prof. Lee Stemkoski from Adelphi University. We’re including this amazing example just to show you what else is possible with AR. In order to see this example in action, you will need to print these two markers, put them on the table and open this URL on your phone.
Seriously, unlike the others, this one won’t work from screen at all, so make sure your printer’s black cartridge/toner is full and get ready to print

